Page 13 - CIBERES2016-ENG
P. 13
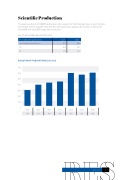
Scientific Production
The graphic evolution of CIBERES publications can be seen from the following tables, in which the data from 2010 to 2016 is analysed. They also detail the publications by group for this year, as well as the interCIBER and intraCIBER cooperation work done.
NO. OF AFFILIATED PUBLICATIONS 2016
EvOlUTION OF PUBlICATIONS 2010-2016
700
600
500
400
300
200
100
0
No. of affiliated publications
2015
2016
No. of affiliated publications
561
585
Q1
303
287
D1
143
126
2010
2011
2012
2013
2014
2015
2016
278
373
409
429
580
550
585
RES
organisation 13